
Market Report November 2023
To harvest or not to harvest
It is becoming increasingly more difficult to prepare quarterly forestry articles which indicate any direction or confidence regarding future log markets. In the August Tree Grower the expectations were that prices would rise and should remain stable through to the end of the year. Yes, we achieved a strong rise in August on export prices. This was only to be short lived with a sudden drop in the United States sale prices combined with increasing shipping costs, and any benefit from a weaker New Zealand dollar has been totally eroded.
Referring to my November 2022 article, it appears that the some of the suggestions or thoughts outlined are starting to materialise a lot sooner than many would have expected. A year on, the industry may have to accept the reality that China will no longer need the volume of logs New Zealand has been supplying over the last 10 years.
Market update
During the last three months discussions with many exporters and domestic customers indicate that the industry is operating month-to-month. Therefore, any assumptions or projections on the market have no commercial foundation, confidence or faith for future planning or investing, including the Emissions Trading Scheme.
The Chinese property market continues to weaken, and it is becoming increasingly clear that their market is over-supplied and the urbanisation programme is complete. There is some reporting that it could take China 10 years for the property market to recover.
Manufacturers are not only experiencing a weak domestic economy but also a reduced global demand for products. Log consumption appears to remain stable, stock levels are down but there appear to be sufficient
deliveries to sustain a smaller inventory of logs as customers purchasing strategies are more controlled.
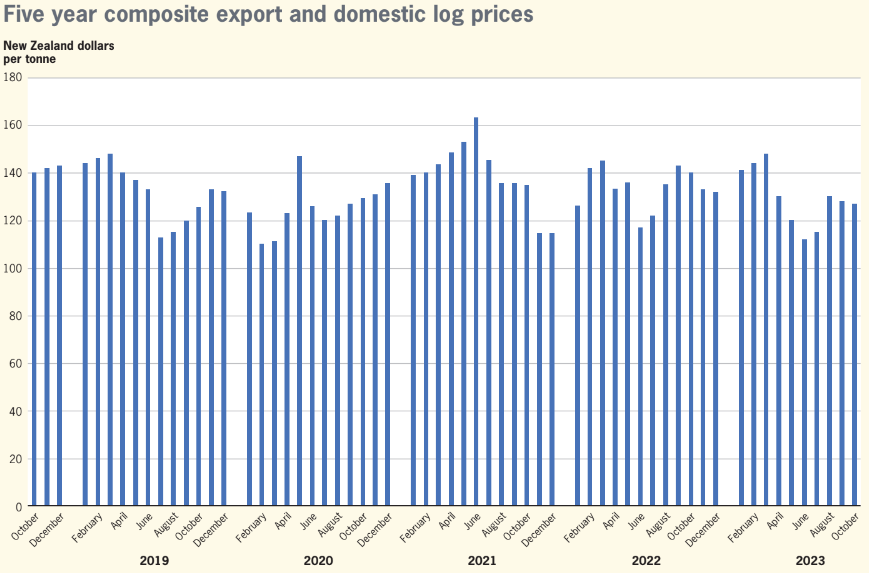
Log prices rose to $120 in August, only to trend back in September and currently there is a range between $115 and $110. This has seen a wide range of prices at the wharf being offered over the last two months, with
large variation between ports.
Currently the central North Island windthrow is producing anything up to 300,000 cubic metres a month, all bound for China. This is expected to last until June next year, but there is no exact time on this. In the meantime, it is a large volume for a depressed market.
Customers know it is coming, so it is difficult to apply any price pressure in a soft demand market. Shipping rates are under pressure and currently at US$33 to US$35 are up from US$28 a few months ago. The domestic market for pruned logs remains stable, although framing logs are coming under pressure as many mills continue to struggle to sell framing timber to the New Zealand construction market. This could take some years to recover if we consider the history of depressed property markets.
In summary it appears that the markets will remain subdued until after Chinese New Year in January and February 2024. There remains the big but – what is going to change for New Zealand suppliers to achieve a better price? There will need to be a concentrated effort for a reduced cut, which is unlikely to take place considering the number of exporters and the way we trade log. Perhaps price is the only lever to make it uneconomic to harvest.
The first graph following was prepared and formulated from a forestry database of actual prices over given months and highlights the composite trend price of all log grades combined.
Private forest owners
Over the years many private forest owners have asked what the effect of the market is on nett returns.
I decided to analyse several forests harvested to assess the effect of current market conditions and operational costs in respect of forest returns over the last five years. As every forest has its own unique aspects with respect to forest roading, distance to markets and mix of markets, along with varying grade yields it is difficult to provide any clarity between one forest and another on actual returns per hectare.
Forest assessment
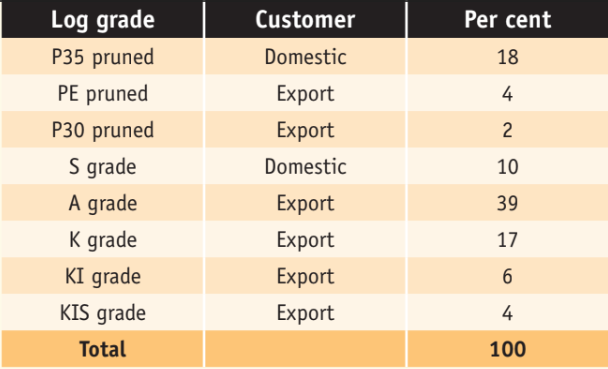
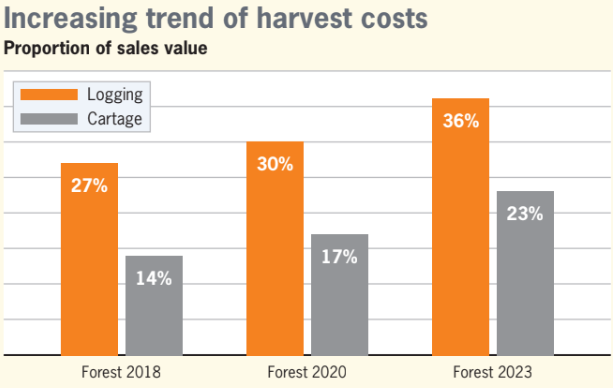
For this exercise, I selected three forests which had very similar grade yields, used a nominal 100 kilometres cartage rate and all forests were hauler logged. The three forests are privately owned, on their first rotation and range in size from 50 hectares to 150 hectares. All forests yields were similar, as shown in the table above right. The effect of reducing forest returns over the last five years are due to increasing logging and cartage
costs. These increases are due mainly to higher fuel, labour and other associated operating costs. In the bottom graph no allowance has been applied for the costs of roading, harvest management or environmental
management.
Composite sales and costs
The graph below highlights the effect on the mean composite sale price achieved over the three forests, the actual costs paid in the harvest year stated, showing that increased costs are eroding forest returns.
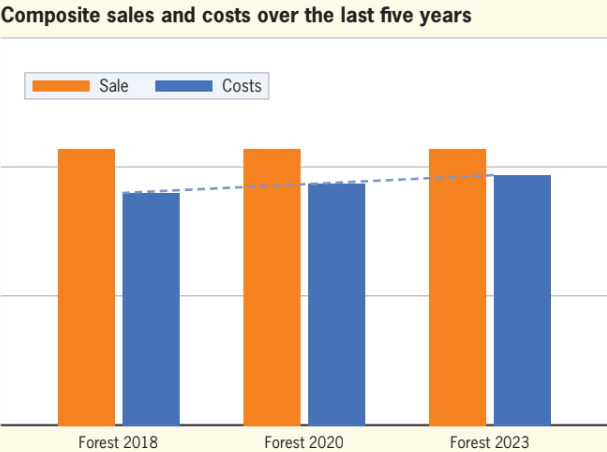
The most interesting point is that the composite sale price achieved has been reasonable stable. Over the harvest period there were monthly ups and downs, but the overall harvest sale price has remained reasonable
consistent. It means that owners need to consider the average sale price over a harvest rather than choosing a spot price to decide when to harvest.
So, what does this mean when it comes to what you will get when you harvest your forest? Costs have increased approximately $19 a tonne over the last five years or $10,000 to $12,000 a hectare.
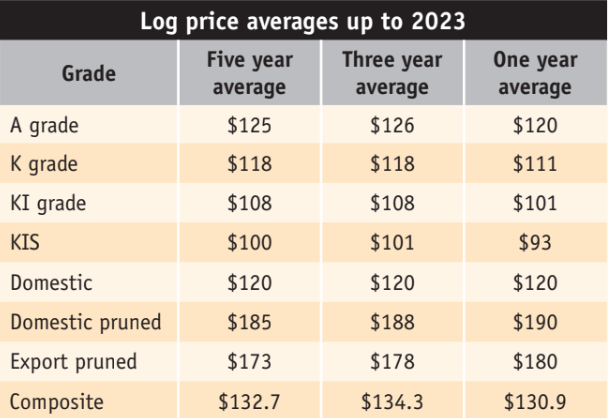
Log price averages over five years
The last table is a summary which shows the log market over the last five years has remained flat. Therefore, considering the current global pressures what can we expect regarding pricing in the future? There is nothing which signals improved sale values. Notably, the domestic market continues to be the best although unfortunately there are limited domestic options for all grades especially in different regions.
To harvest or not
The data tells the story that over the last five years the market has been flat and trending down, with input costs up and unlikely to fall considering inflation pressure, fuel and labour costs. With the current and future reliance New Zealand will have on export log markets, which is where up to 80 per cent of logs are sold, the perceived expectation for many private forest owners of forest returns are often unfounded.
Unfortunately, many private growers do not obtain a valuation and therefore do not know what the value of their forest investment is. To harvest or not harvest is usually the question being asked. Most owners of small forests have their trees effectively as a passive investment meaning there is no pressure to harvest the trees which will continue to grow and put on more weight. However, at some point after 25 to 30 years most owners would like to realise some return on the investment and cash up. Many growers are waiting for the market to improve, but as outlined above, a flat market and increasing costs are only eroding future investment value.
All forest owners are optimistic about the industry and were optimistic when the trees were planted 25 or 30 years ago. But the markets have not matured as hoped and today a new realism needs to be considered from a very different commercial viewpoint.
Log price table key
Understanding the figures (below)
- Domestic prices are per tonne landed "at mill door".
- Prices are GST exclusive.
- Export prices are per JAS cubic metre landed "at wharf gate".
- The absence of data reflects insufficient sales.
- Prices above or below those indicated are entirely possible if wood quality exceeds or is below the normal market expectation.
- P1 AND P2 grades are pruned logs with a minimum 40cm SED and 34cm SED respectively (note SED = Small End Diameter)
- S30 and S20 grades are small branch logs with a minimum 30cm SED and 20cm SED respectively
- L30/A30 grades are large branch logs with a minimum 30cm SED
- K grade are export logs sold to Korea. KA grade is better grade log with a minimum 30cm SED. K grade are smaller standard multi purpose logs and KI is a large branch large Industrial log.
- S30 price for Northern South Island relates to N35 grade
Radiata pine log sales
| NZ$ per tonne |
North NI
|
Central NI
|
South NI
|
North SI
|
Central SI
|
South SI
|
|---|---|---|---|---|---|---|
| P1 (P36-P38) |
172-192
|
175-190
|
170-180
|
172-180
|
167-175
|
175-185
|
| S30 |
125-140
|
125-133
|
120-125
|
120-126
|
120-125
|
122-127
|
| S20 |
116-121
|
111-116
|
101-106
|
109-113
|
96-101
|
-
|
| L30/A30 |
101-110
|
-
|
-
|
-
|
95-105
|
100-105
|
| Postwood |
82-95
|
90-100
|
84-94
|
72-90
|
90-100
|
82-93
|
| Chip |
54-59
|
48-52
|
46-51
|
45-50
|
50-54
|
44-48
|
| NZ$ per JAS | ||||||
| Pruned (P40) |
181-185
|
184-188
|
174-178
|
168-172
|
161-165
|
172-176
|
| Pruned (P32) |
146-150
|
149-153
|
139-133
|
137-141
|
131-135
|
135-139
|
| A grade |
127-131
|
129-132
|
117-120
|
119-122
|
111-114
|
115-118
|
| CS/KS |
122-126
|
124-128
|
113-117
|
115-119
|
104-107
|
108-111
|
| CI/KI |
109-113
|
111-114
|
102-105
|
104-108
|
96-99
|
105-109
|
| Pulp (CIS/KIS) |
104-107
|
106-109
|
109-111
|
98-101
|
89-92
|
95-98
|
Comparing JAS and a tonne of logsThe conversion rate from a JAS cubic metre and a tonne of logs is usually about 0.95 although this can vary. It depends on −
If we accept an average day, average site and the 0.95 conversion rate, an export log grade comparative for an S30 log sold domestically would need to be about $137 per JAS to compare with a $130 a tonne for a domestic sale. |
||||||
Macrocarpa log sales
| Macrocarpa logs | South Island Landed at mill door/tonne |
North Island Landed at mill door/tonne |
|---|---|---|
| Pruned Min SED 40cm | $350 - $375 | - |
| Pruned Min SED 30cm | $170 - $190 | - |
| Small branch Min SED 30cm | $160 - $175 | - |
| Small branch Min SED 20cm | $140 - $150 | - |
| Large branch/Boxing/Sleeper | $120 - $125 | - |
| Firewood logs | $75 - $85 | - |
Kelly Coglan is Director of Taml Forestry in Taranaki.